Octant Monitor
Last update: 2024-10-30 08:21:17
Locks and unlocks
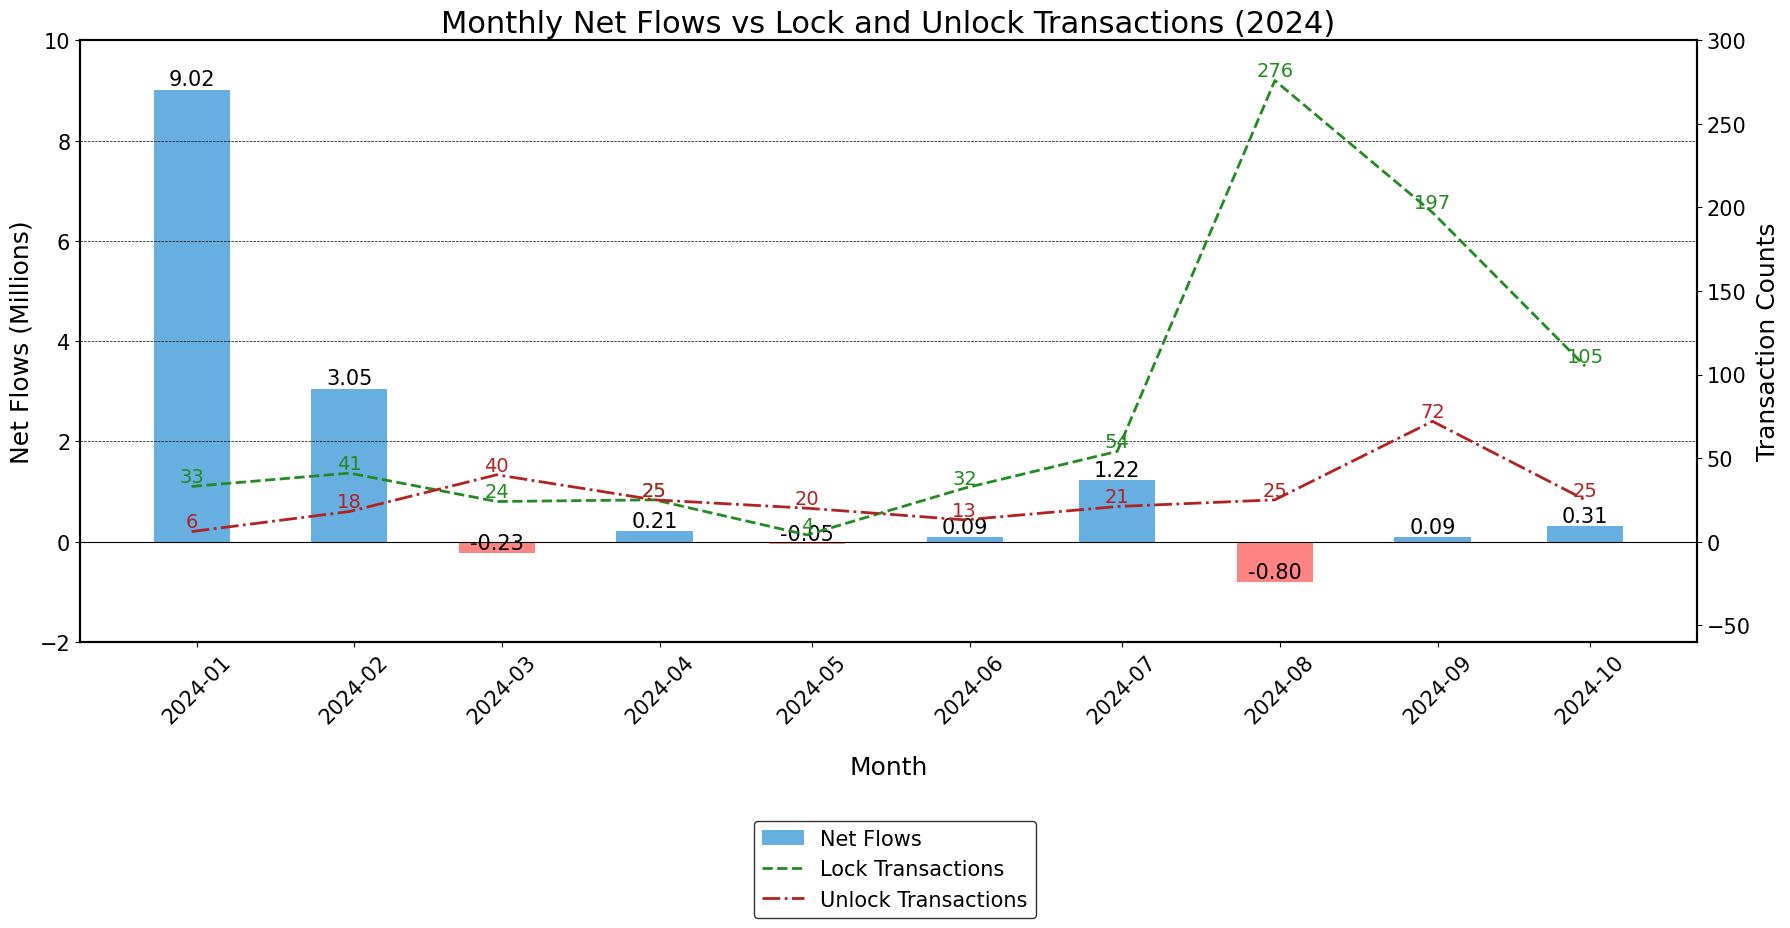
Octant Aggregates
Key stats from Octant epochs 1-5
| epoch | budget | budget_allocated | donations | leftover (%) | generosity (%) |
|---|---|---|---|---|---|
| 1 | 101.469 | 75.913 | 5.527 | 25.2 | 7.3 |
| 2 | 138.233 | 137.941 | 3.925 | 0.2 | 2.8 |
| 3 | 241.301 | 239.465 | 25.484 | 0.8 | 10.6 |
| 4 | 214.744 | 203.187 | 4.788 | 5.4 | 2.4 |
| 5 | 220.261 | 205.297 | 17.630 | 6.8 | 8.6 |
| epoch | potential_users | allocators | donors | ga_beneficiaries | turnout (%) |
|---|---|---|---|---|---|
| 1 | 515 | 362 | 347 | 15 | 70.3 |
| 2 | 586 | 366 | 332 | 14 | 62.5 |
| 3 | 603 | 320 | 285 | 15 | 53.1 |
| 4 | 593 | 303 | 279 | 16 | 51.1 |
| 5 | 898 | 439 | 422 | 232 | 48.9 |
Note: patron mode not included (yet).
Users
(1.1) Epoch progress
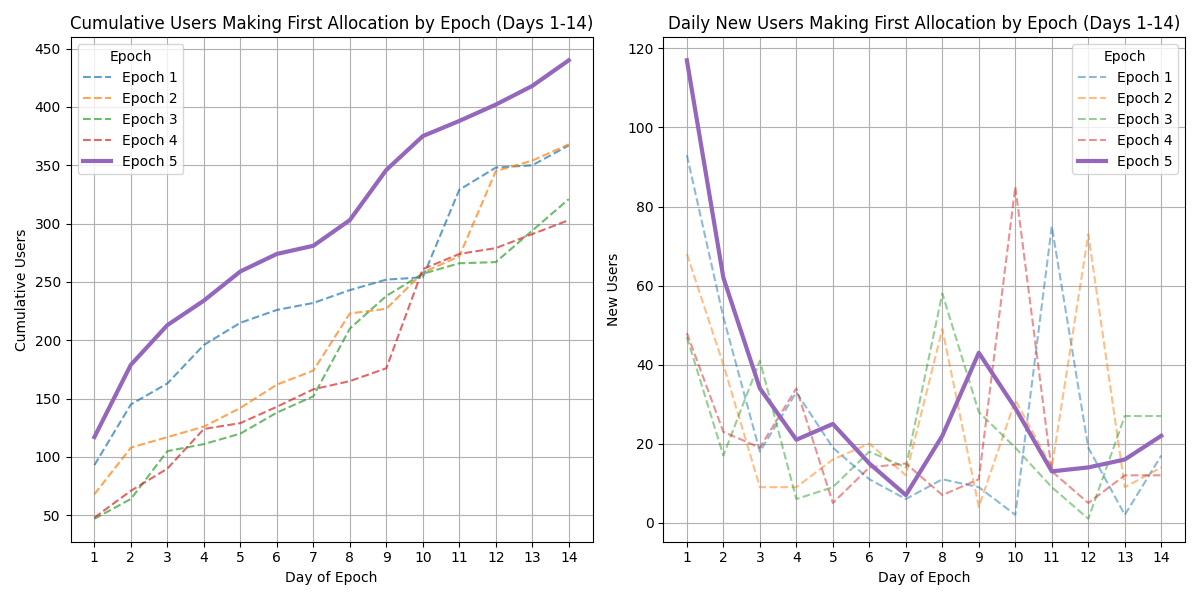
- Heavy growth in the beginning of the 2nd week.
- More steady vs. previous epochs (no sybil boost)
(1.3) Epoch Turnout

Lower turnout % vs Epoch 4 is slightly deceiving. If the 60+ sybil accounts made their allocation, we would have ended up with higher turnout this Epoch.
(1.4) Allocation Changes
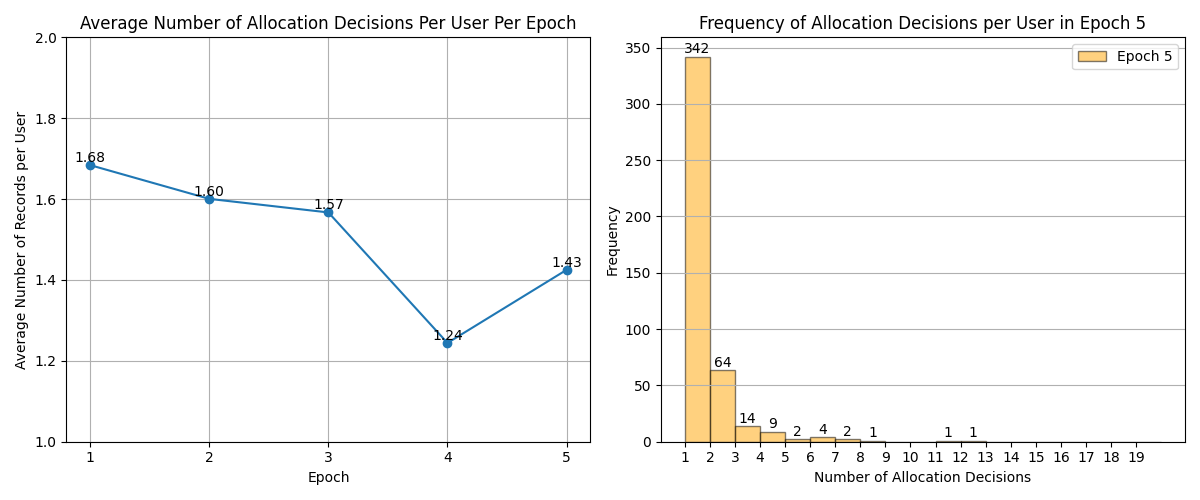
Users rarely change their allocation decision (more stability of results due to QF, less heavy-weight testing by team members). Growth vs Epoch 4 mostly due to the sybil addresses pulling out (60+ addresses with no allocation changes).
(1.5) Distribution of Donations

As usual donations (in absolute terms) are dominated by the whale category, which is by far the most important contributor to the overall generosity rate. Allocation to budget ratio is relatively stable in other categories, but we can see some growth in the M category.
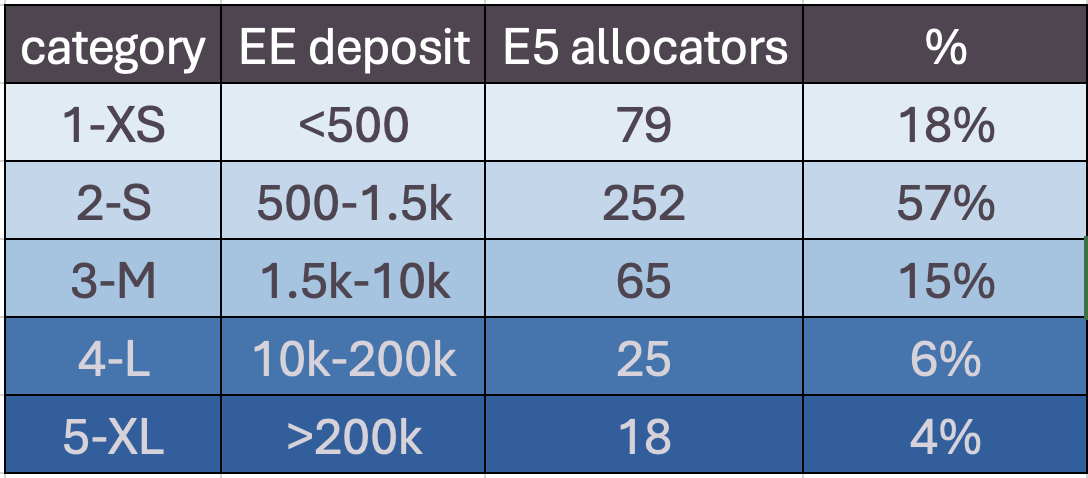
(1.6) User Types
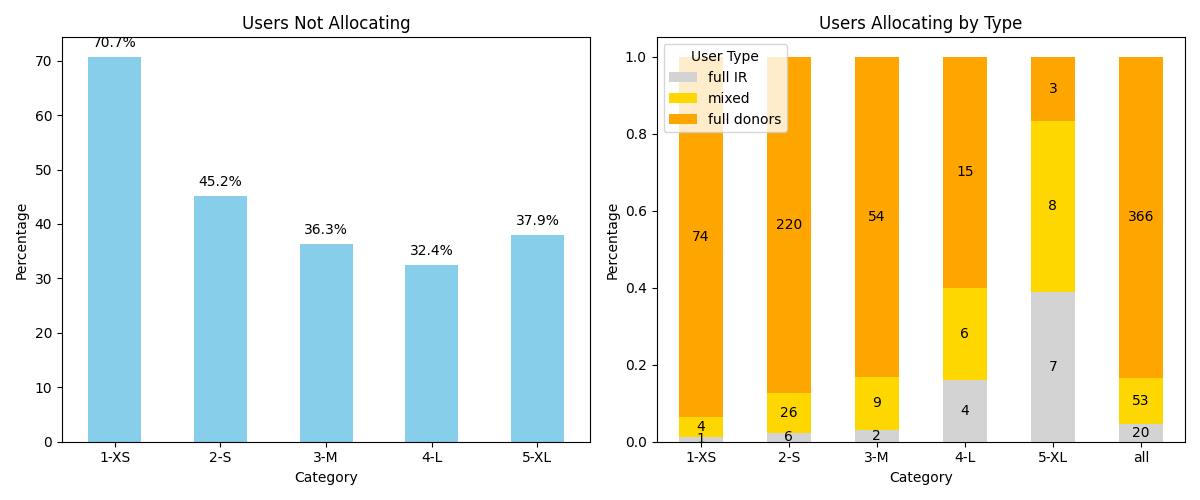
Non-participating users are over represented in the XS category (which is a good thing - syblis?). Note that the vast majority of users fall into to full donor category (>98% of budget allocated to projects) and that the mixed category (2%-98% of budget allocated to projects) are quite an important part of the middle class users.
(1.7) Projects Supported
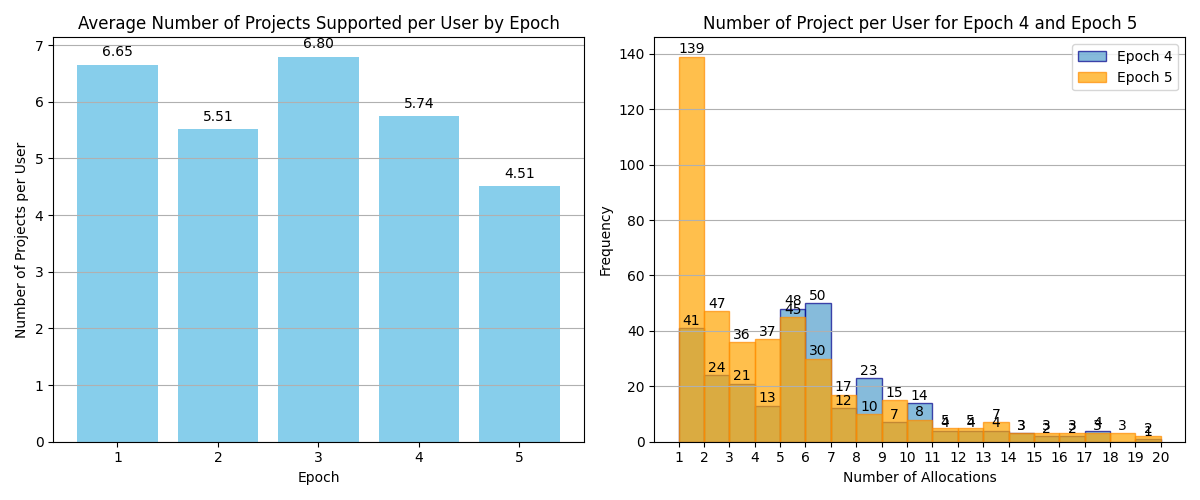
The falling average number of projects supported can be attributed to the introduction of GLM marketing campaigns. “Old” users keep the average at a level similar to Epoch 4, while users who received GLM giveaways in Epoch 5 tend to concentrate their votes more (less than 4 projects on average).
Funding Distribution
(2.1) QF vs Linear Distribution

If we applied linear distribution, only 7 projects would receive funding, with ca. 90% of the MF being captured by 5 projects supposed by the single whale. Note that Protocol Guild did not receive the highest amount of donations and yet managed to be at the top of the leaderboard when we applied QF.
(2.2) Correlations
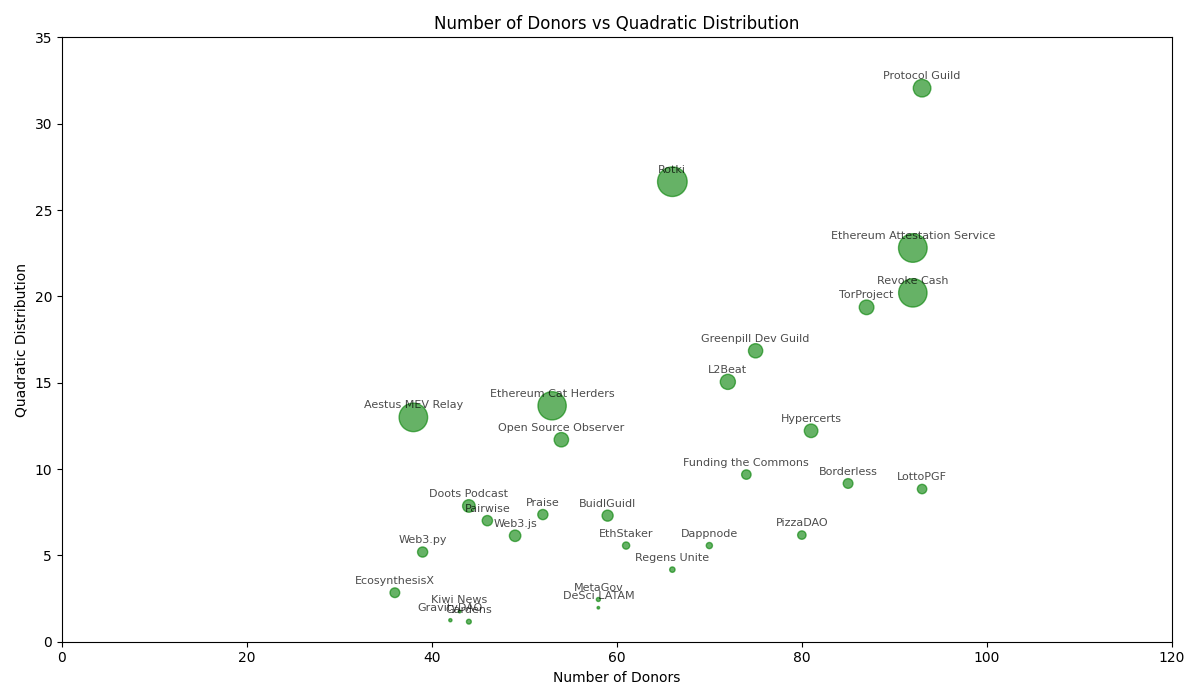
Interesting stuff: 1) lower variation in the number of donors, 2) similar total donation amounts lead to entirely different shared in Matching Funding (due to QF).
(2.3) Leverage Differences
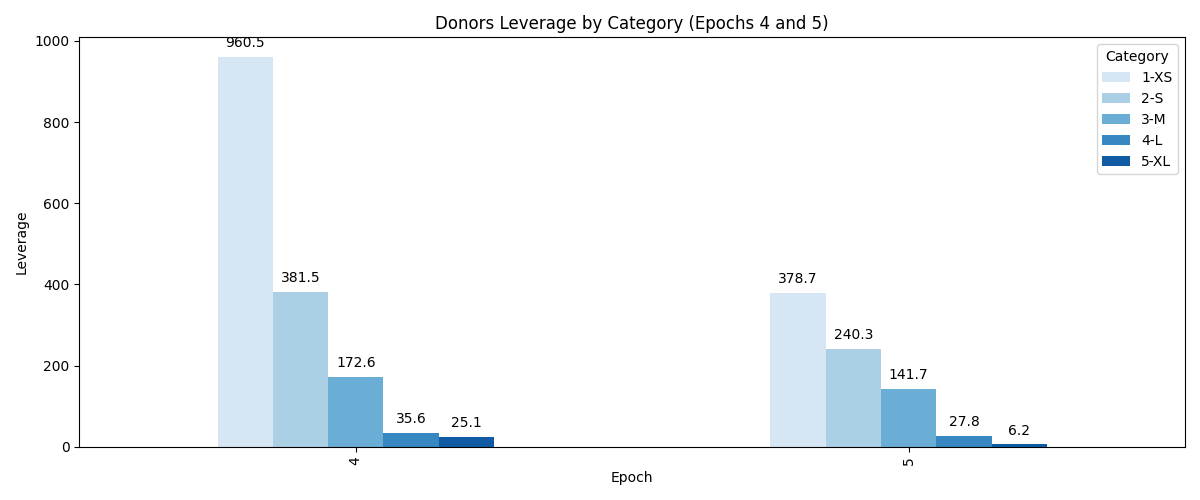
As expected, leverage decreases as (on average) the amount of donations/budget increases. Note that all users categories except for the whales are better off (i.e. above the overall Epoch 5 leverage of 17x). The leverage is lower in Epoch 5 due to higher amount of donations, which is a consequence of using the relative QF mechanism.
(2.4) Voting Power
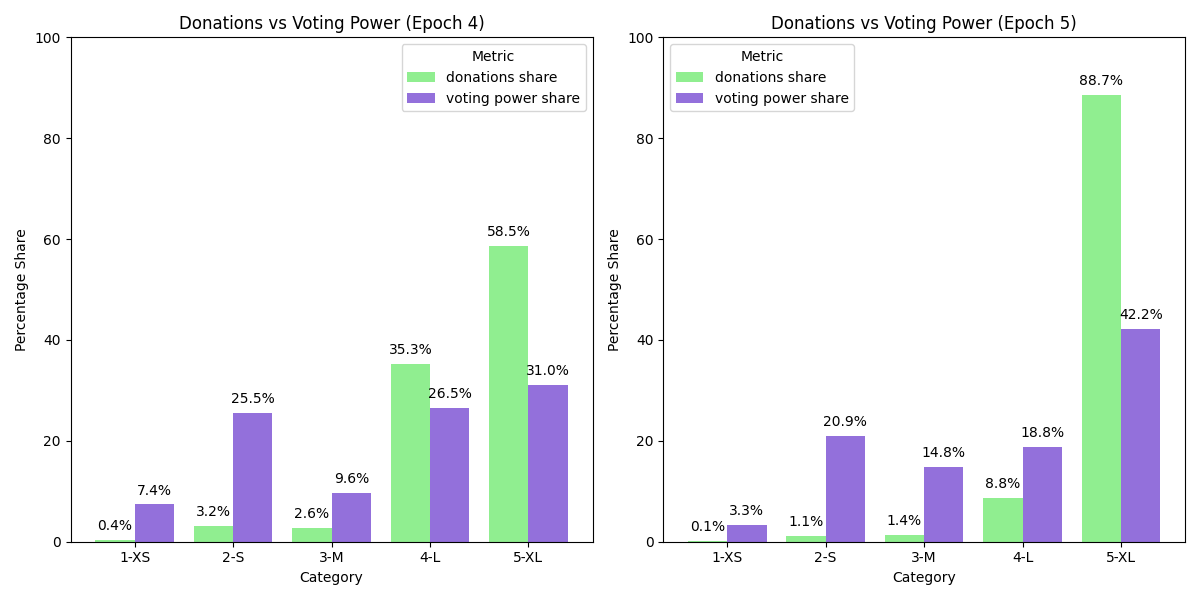
With QF whales don’t have even 50% of voting power, despite being responsible for 88% of donations. On the other hand, XS, S and M categories combined enjoy almost 40% of voting power with less than 3% of total donations.
(2.5) Proper QF
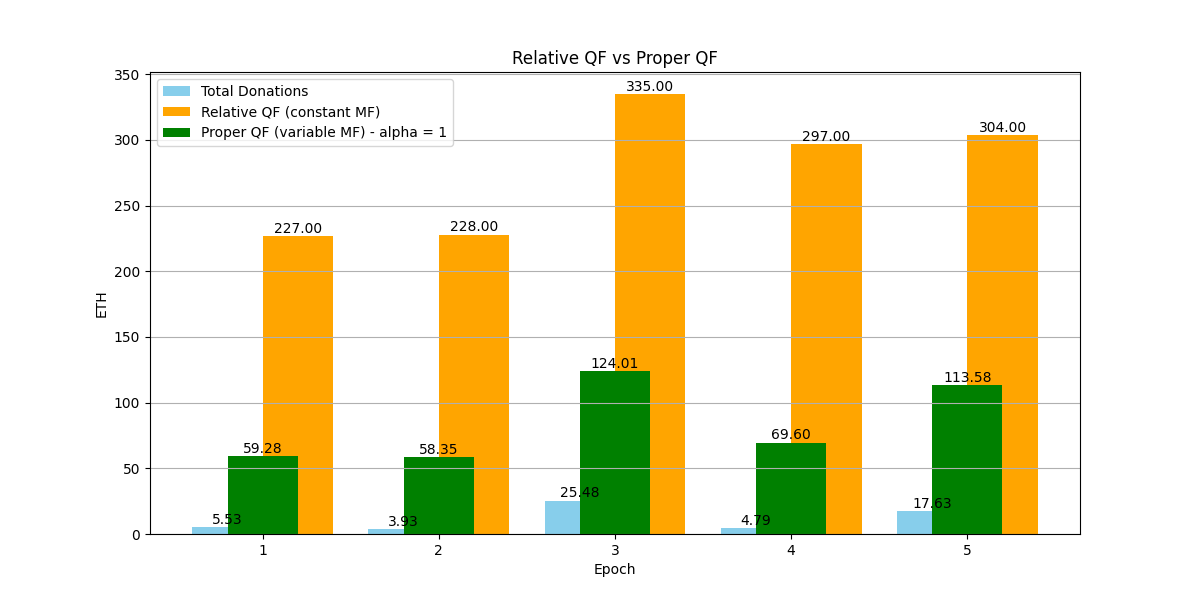
In Epoch 5 we would need to set alpha at 2.7 to use up the entire available MF.
Marketing & Raffle
(3.3) Decay Over Time
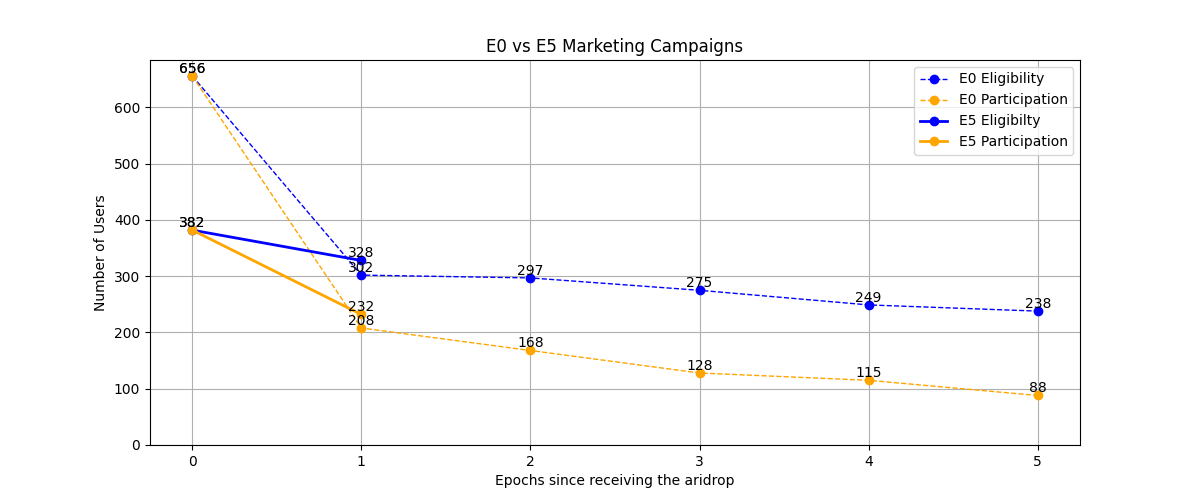
The history of E0 airdrop users shows that participation decays over time, with only 42% being still active after a year since participating in the first epoch.
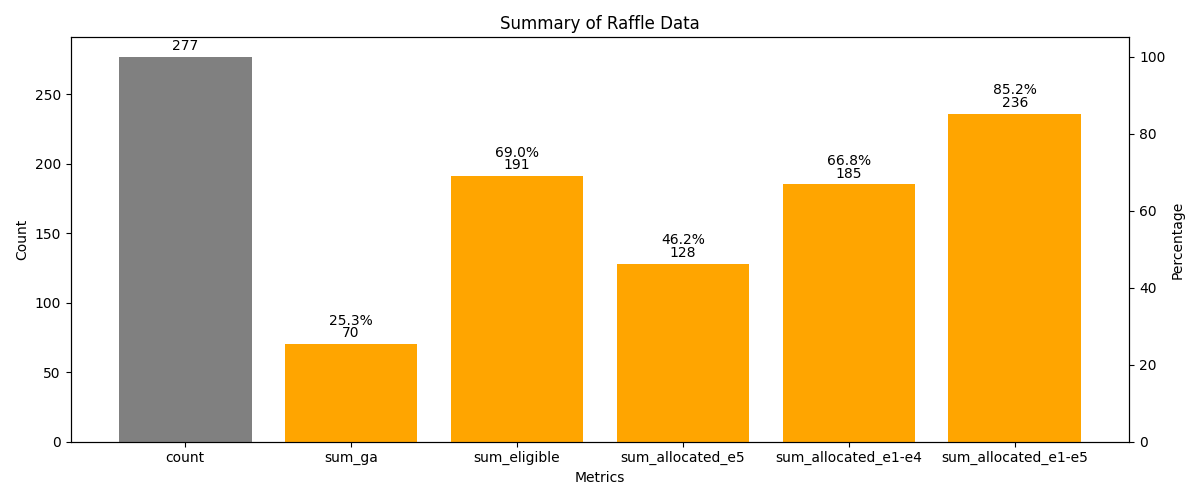
(3.4) Raffle Net Effect
Raffle Users
| budget_sum | amount_sum | record_count | amount_to_budget_ratio | |
|---|---|---|---|---|
| epoch | ||||
| 4 | 0.268 | 0.179 | 63 | 67.0 |
| 5 | 0.379 | 0.301 | 63 | 79.4 |
| Difference | 12.4 |
Non-Raffle Users
| budget_sum | amount_sum | record_count | amount_to_budget_ratio | |
|---|---|---|---|---|
| epoch | ||||
| 4 | 20.928 | 2.455 | 93 | 11.7 |
| 5 | 21.686 | 3.789 | 93 | 17.5 |
| Difference | 5.8 |
If we had to come up with a number, the net effect of the Raffle can be estimated at 0.06 ETH of additional donations.
Interesting stuff: Only 46% of users who signed up to the Raffle did their allocation in AW5 (69% were eligible). Ca. 45 addresses signed up for the Raffle despite not being Octant users anymore (participated in Epochs 1-4, but no longer eligible to participate in Epoch 5).